


Weekly Economic Update
Last Week and the Economy
- Unemployment Situation Update
- Hormuz Shipping Resumes
- Manufacturing Expansion Cools
- Quarterly Economic Update
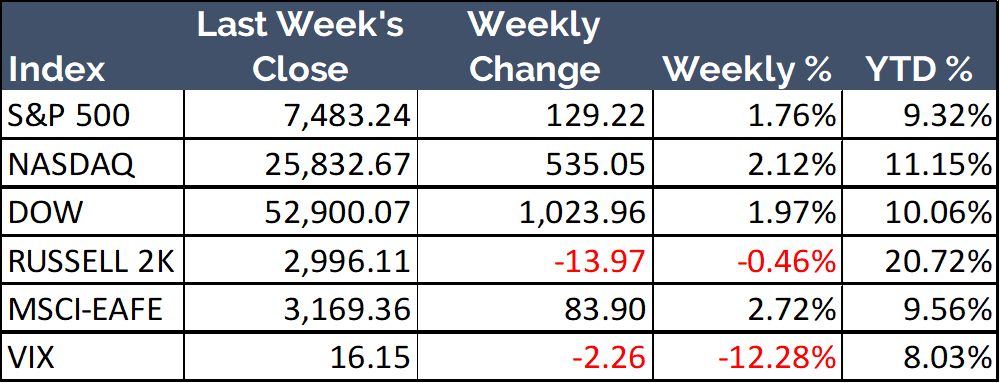
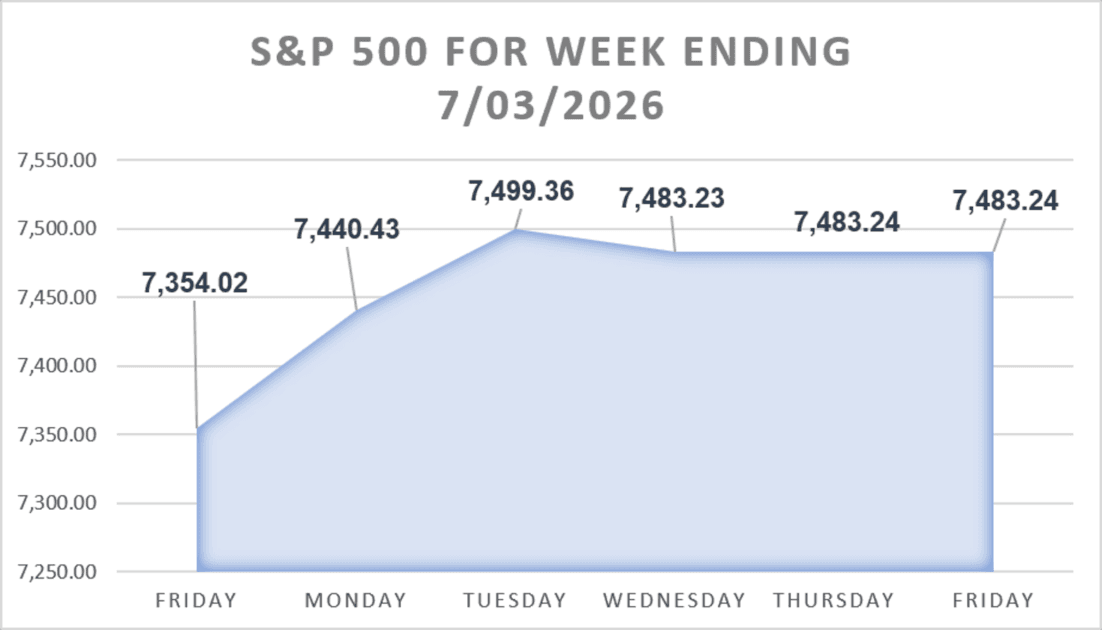
Major U.S. stock indices delivered mixed results during a holiday-shortened week ahead of Independence Day. The tech-heavy Nasdaq Composite led the advancing benchmarks with a 2.12% gain. The Dow Jones Industrial Average rose 1.97% and the S&P 500 Index climbed 1.76%. The small-cap Russell 2000 Index broke the positive trend with a decline of 0.46%. Overseas, the MSCI EAFE Index added 2.72%.
Nonfarm Payroll Growth Slows Sharply in June
The U.S. Bureau of Labor Statistics [BLS] released its June 2026 Employment Situation report on Thursday. The report showed 57,000 new nonfarm payroll jobs for the month – a figure that missed the consensus forecast of 115,000 positions. It also marked the weakest payroll reading since February. The agency revised down its April and May figures by a combined 74,000 positions, which points to a softer hiring trend than earlier estimates showed.
The national unemployment rate fell to 4.2% in June, down from 4.3% in May. This came alongside a labor force participation rate declined of 0.3 percentage points to 61.5%.
Professional and business services led the month’s gains with 36,000 new positions. Social assistance added 25,000 jobs and health care added 22,000. Leisure and hospitality moved the other way with a loss of 61,000 positions – a drop the BLS tied to weaker-than-usual seasonal hiring.
On the bright side, wage growth held steady during the month. Average hourly earnings for private nonfarm employees rose 13 cents, or 0.3%, to $37.64. Nominal hourly wages have risen 3.5% over the past 12 months. The average workweek for all private-sector employees held at 34.3 hours. The complete data set appears in the BLS Employment Situation report.
Oil Prices Hold Near Pre-War Lows as Hormuz Shipping Resumes
Maritime traffic through the Strait of Hormuz continued to recover after the United States and Iran signed a memorandum of understanding on June 17, 2026. The agreement reopened the strait, lifted the U.S. naval blockade of Iranian ports, and set up a 60-day window to negotiate a lasting settlement. Iran agreed to let ships transit toll-free during that window. Iran also insisted that it retains administrative control over the waterway.
The recovery has moved slowly. Freight operators remain cautious over sea-mine risk, elevated war-risk insurance costs, and the unsettled peace framework. Some operators have avoided the waterway or masked vessel movements. Analysts caution that traffic still sits well below pre-war volumes.
Crude oil held near pre-war levels through the week. West Texas Intermediate [WTI] traded around the high $60s per barrel, and Brent held near $72. Prices have retreated sharply from the wartime peak above $120 reached in late April.
Questions over transit fees and long-term control of the strait remain unresolved. Regional analysts expect Iran to keep leverage over the chokepoint even after the negotiating window closes. Full coverage of the talks appears in CNBC’s reporting on the U.S.–Iran memorandum of understanding.
Manufacturing Expansion Cools as Price Pressures Ease
U.S. manufacturing growth slowed at the end of the second quarter. The Institute for Supply Management [ISM] reported on Wednesday, July 1, that its Manufacturing Purchasing Managers’ Index [PMI] registered 53.3% in June. That figure fell 0.7 percentage points from May’s 54.0% and landed below the consensus forecast of 54.0%. Fortunately, the index held above the 50.0% mark for the sixth straight month, which confirms continued expansion across the sector.
Core demand indicators softened but stayed in growth territory. The new orders index registered 56.0%, down from 56.8% in May, while production eased to 52.2% from 54.3%. The employment index improved to 49.7% from 48.6%, though it stayed in contraction. Factory operators continued to hold staffing lean.
The sharpest move came in the pricing component. The prices index dropped to 73.0% from 82.1% in May, a 9.1 percentage-point decline. Input costs still rose, but at a far slower pace. Supply executives pointed to easing shipping delays and lower commodity pressures, even as Middle East disruptions and tariffs continued to affect raw materials. TD Economics published the full industry breakdown.
Quarterly Economic Update
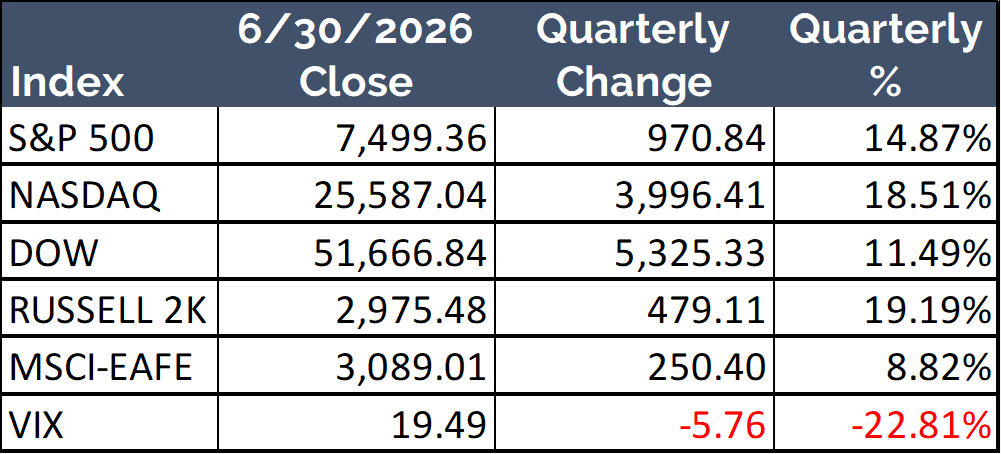
U.S. equity indices posted broad gains in the second quarter of 2026. The small-cap Russell 2000 Index led every tracked benchmark with a 19.19% quarterly advance. The tech-heavy Nasdaq Composite followed close behind, up 18.51%. Further, the S&P 500 Index rose 14.87% and the Dow Jones Industrial Average added 11.49%. Overseas, the MSCI EAFE Index also climbed by 8.82%. Finally, the Cboe Volatility Index [VIX] indicated reduced volatility during the quarter – falling 22.81% to 19.49.
Data Sources for stock and index quotes: Yahoo Finance, WSJ
Trending Articles

How to Calculate Provisional Income (a.k.a. Combined Income)
August 14, 2025School of Social Security & Medicare
Your provisional income determines if Social Security benefits are taxable, so it is important to know how to calculate this figure.

5 Characteristics of a Quality Wealth Manager
June 15, 2023School of Financial Wellness
Looking for a quality wealth manager? We pulled together our list of the 5 most important qualities to consider during your search.

The 10 Worst States for Retirement
March 28, 2024School of Financial Wellness
The location you choose for your retirement can have a significant impact on your costs, safety, activities, and overall happiness.
Key Economic Data Points
| Data Point | Date | Current | Change from Prior Period | Next Report |
| Unemployment Rate | 06-2026 | 4.2% | -0.1 | July 2nd |
| FOMC Target Rate | 06-2026 | 3.50% – 3.75% | No Change | July 29th |
| GDP | Q1 2026 (3rd estimate) | 2.1% | +0.5 | July 30th |
| PCE Inflation | 05-2026 | 4.1% | +0.3 | July 30th |
Data Sources: U.S. Bureau of Labor Statistics, Federal Reserve, U.S. Bureau of Economic Analysis, U.S. Bureau of Economic Analysis
Weekly Quote:
Money looks better in the bank than on your feet.
-Sophia Amoruso – Entrepreneur
The Week Ahead – Economic Data & Events
Monday: Global Supply Chain Pressure Index, ISM Non-Manufacturing
Tuesday: Advance International Trade in Goods, Trade balance, Survey of Consumer Expectations
Wednesday: Wholesale Trade
Thursday: NAR Existing Home Sales
Friday: No additional reports or data releases.
Weekly Reports: Mortgage Applications (Wednesday), EIA Petroleum Status Report (Wednesday), Jobless Claims (Thursday), EIA Natural Gas (Thursday), Fed Balance Sheet (Thursday), Baker Hughes Rig Count (Friday), New York Fed Staff Nowcast (Friday)
Source: New York Fed
The Week Ahead – S&P 500 Companies Reporting Earnings
Monday: No S&P 500 companies confirmed for this date.
Tuesday: No S&P 500 companies confirmed for this date.
Wednesday: No S&P 500 companies confirmed for this date.
Thursday: PepsiCo, Inc. (PEP): PMO
Friday: Delta Air Lines, Inc. (DAL): PMO
AMC = After Market Close, PMO = Prior to Market Open
Source: Yahoo Finance
Weekly Tip:
How can a girl go 25 days without sleep?
Data Sources for stock and index quotes: Yahoo Finance, WSJ
Join Us for Our Next Meld University Events:
Last Week's Riddle and Answer
Last Week's Riddle:
What has a head and a tail, is brown, but has no legs?
Last Week's Answer:
A penny.
Meld Financial, Inc. is a registered investment advisor.
The information contained herein should not be construed as legal advice or a legal opinion on any factual situation. Its contents are intended for general information purposes only. Always consult with a competent professional service provider for advice on tax, accounting, and other financial matters specific to your situation.
Investing involves risks, and investment decisions should be based on your own goals, time horizon, and tolerance for risk. The return and principal value of investments will fluctuate as market conditions change. When sold, investments may be worth more or less than their original cost.
The forecasts or forward-looking statements are based on assumptions, may not materialize, and are subject to revision without notice.
The market indexes discussed are unmanaged, and generally, considered representative of their respective markets. Index performance is not indicative of the past performance of a particular investment. Indexes do not incur management fees, costs, and expenses. Individuals cannot directly invest in unmanaged indexes. Past performance does not guarantee future results.
Riddles used in this publication may originate from the books: Lateral Thinking Puzzles by Paul Sloane; or from Workspace Solutions, LLC.
The Dow Jones Industrial Average is an unmanaged index that is generally considered representative of large-capitalization companies on the U.S. stock market. Nasdaq Composite is an index of the common stocks and similar securities listed on the Nasdaq stock market and is considered a broad indicator of the performance of technology and growth companies. The MSCI EAFE Index was created by Morgan Stanley Capital International (MSCI) and serves as a benchmark of the performance of major international equity markets, as represented by 21 major MSCI indexes from Europe, Australia, and Southeast Asia. The S&P 500 Composite Index is an unmanaged group of securities that are considered to be representative of the stock market in general.
U.S. Treasury Notes are guaranteed by the federal government as to the timely payment of principal and interest. However, if you sell a Treasury Note prior to maturity, it may be worth more or less than the original price paid. Fixed income investments are subject to various risks including changes in interest rates, credit quality, inflation risk, market valuations, prepayments, corporate events, tax ramifications and other factors.
International investments carry additional risks, which include differences in financial reporting standards, currency exchange rates, political risks unique to a specific country, foreign taxes and regulations, and the potential for illiquid markets. These factors may result in greater share price volatility.
Please consult your financial professional for additional information.
This content is developed from sources believed to be providing accurate information. The information in this material is not intended as tax or legal advice. Please consult legal or tax professionals for specific information regarding your individual situation. The opinions expressed and material provided are for general information, and they should not be considered a solicitation for the purchase or sale of any security.