
Weekly Economic Update
Last Week and the Economy
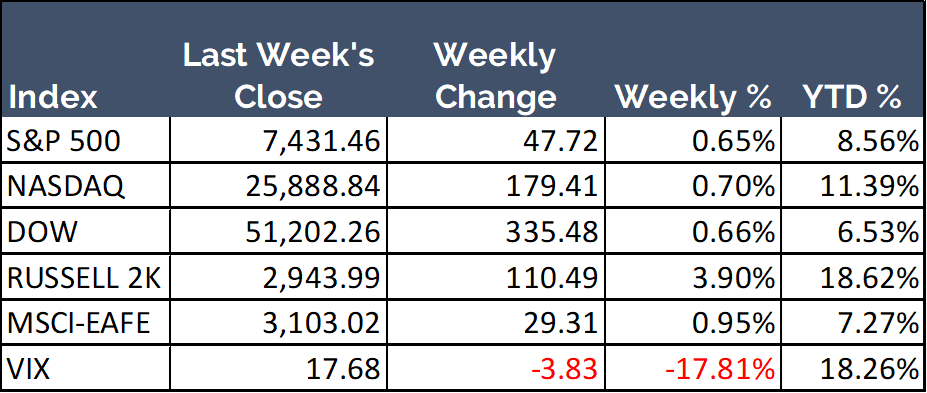
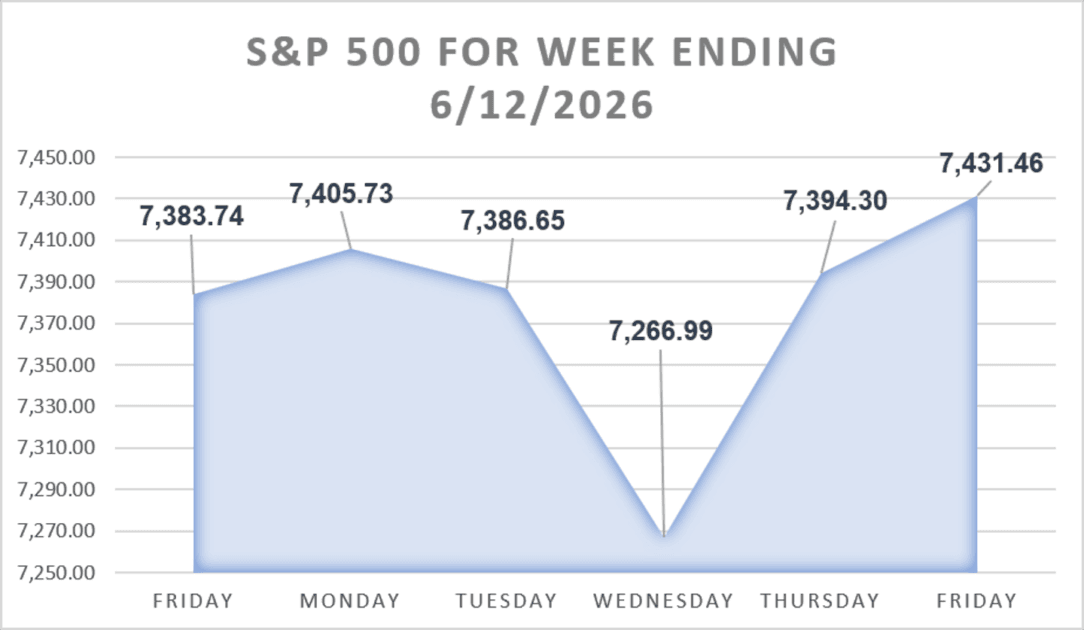
Equities closed a turbulent week higher, with gains concentrated in small caps. The S&P 500 rose 0.65% for the week, and the Nasdaq Composite added 0.70%. The Dow Jones Industrial Average also gained a similar 0.66%. The Russell 2000 index of small-cap stocks outpaced its large-cap peers, climbing 3.90%. The MSCI-EAFE index of overseas stocks rose by 0.95%.
Iran Tensions Shake Markets Before Easing
The war with Iran has unsettled markets since late February, when the first strikes disrupted oil shipments through the Strait of Hormuz. That pressure intensified last week when stocks sold off on June 9 and June 10. The selloff came as President Trump signaled fresh strikes on Iran, and the Dow shed roughly 900 points in a single day as the threat sharpened.
The mood reversed late in the week. On June 11, signals of a deal from Washington and Tehran sent equities sharply higher, and the Dow recovered about 930 points. The next day, Trump said he had called off planned strikes overnight and that an agreement to end the war and reopen the Strait of Hormuz would soon be finalized. A senior administration official put the odds of a signed deal at 80%.
Oil fell as the de-escalation took hold. West Texas Intermediate [WTI] crude dropped about 6% over the week to settle at $84.88 per barrel, and Brent settled at $87.33. Both benchmarks still trade more than 20% above their pre-conflict levels from late February. The path of oil from here rests on whether the agreement holds and the Strait of Hormuz reopens to normal traffic.
May CPI Climbs to 4.2%, the Highest in More Than Three Years
The Bureau of Labor Statistics reported that the Consumer Price Index for All Urban Consumers [CPI-U] rose 0.5% in May on a seasonally adjusted basis, after a 0.6% increase in April. The all-items index rose 4.2% over the prior 12 months before seasonal adjustment. That pace accelerated from 3.8% in April and marked the highest annual reading in more than three years.
Energy drove the increase. The energy index rose 3.9% in May, after a 3.8% gain in April, and accounted for more than 60% of the monthly rise in the all-items index. Gasoline climbed 7.0% over the month.
Core inflation held firmer ground. The index for all items less food and energy – the core gauge that excludes those volatile categories – rose 0.2% in May. The annual core rate edged up to 2.9%, from 2.8% over the 12 months ending in April. The split points to a clear divide – energy is driving the headline number higher, while underlying price growth stays comparatively contained.
Consumer Sentiment Rebounds on Early-Month Gas Relief
The University of Michigan’s preliminary June reading for its Index of Consumer Sentiment rose to 48.9, up from a final May level of 44.8 that marked a record low. The reading was the first increase in four months. Year-ahead inflation expectations eased to 4.6% from 4.8%, and the longer-run measure fell to 3.4% from 3.9%, though both stayed well above their pre-conflict levels.
Survey director Joanne Hsu attributed the lift to easing gasoline prices early in June, and noted the gains spread across age, education, and political affiliation. However, the timing matters for how to read the number. Interviewers completed responses between May 19 and June 8, so the figure captures early-month fuel relief rather than the sharp oil decline that followed later in the week. Inflation worries still ran high during the survey.
Sentiment remains fragile despite the bounce. The index sits roughly 13% below its January 2026 level and about 19% below where it stood a year earlier. Lower fuel prices offered households a measure of relief, but the broader mood will hinge on whether inflation cools from here.
Data Sources for stock and index quotes: Yahoo Finance, WSJ
Trending Articles

How to Calculate Provisional Income (a.k.a. Combined Income)
August 14, 2025School of Social Security & Medicare
Your provisional income determines if Social Security benefits are taxable, so it is important to know how to calculate this figure.

5 Characteristics of a Quality Wealth Manager
June 15, 2023School of Financial Wellness
Looking for a quality wealth manager? We pulled together our list of the 5 most important qualities to consider during your search.

The 10 Worst States for Retirement
March 28, 2024School of Financial Wellness
The location you choose for your retirement can have a significant impact on your costs, safety, activities, and overall happiness.
Key Economic Data Points
| Data Point | Date | Current | Change from Prior Period | Next Report |
| Unemployment Rate | 05-2026 | 4.3% | No Change | July 2nd |
| FOMC Target Rate | 04-2026 | 3.50% – 3.75% | No Change | June 17th |
| GDP | Q1 2026 (revised) | 1.6% | +1.1 | June 25th |
| PCE Inflation | 04-2026 | 3.8% | +0.3 | June 25th |
Data Sources: U.S. Bureau of Labor Statistics, Federal Reserve, U.S. Bureau of Economic Analysis, U.S. Bureau of Economic Analysis
Weekly Quote:
Our greatest glory is not in never falling, but in rising every time we fall.
-Confucius – Chinese Philosopher
The Week Ahead – Economic Data & Events
Monday: Empire State Manufacturing Survey, Industrial Production and Capacity Utilization
Tuesday: Imports & Exports, New Residential Construction
Wednesday: Advance Retail Sales, Business Inventories, NAR Pending Home Sales, Index, Outlook-At-Risk
Thursday: Philadelphia Fed Manufacturing Survey, New York Fed Staff Nowcast
Friday: No Data or Events
Weekly Reports: Mortgage Applications (Wednesday), EIA Petroleum Status Report (Wednesday), Jobless Claims (Thursday), EIA Natural Gas (Thursday), Fed Balance Sheet (Thursday), Baker Hughes Rig Count (Friday)
Source: New York Fed
The Week Ahead – S&P 500 Companies Reporting Earnings
Monday: No S&P 500 companies confirmed for this date.
Tuesday: No S&P 500 companies confirmed for this date.
Wednesday: Jabil Inc. (JBL): PMO
Thursday: Accenture plc (ACN): PMO, The Kroger Co. (KR): PMO
Friday: No S&P 500 companies confirmed for this date.
AMC = After Market Close, PMO = Prior to Market Open
Source: Yahoo Finance
Weekly Tip:
Pay yourself first. Set up an automatic transfer to savings the day your paycheck arrives. What you don't see, you don't spend.
Data Sources for stock and index quotes: Yahoo Finance, WSJ
Join Us for Our Next Meld University Events:
Last Week's Riddle and Answer
Last Week's Riddle:
I'm light as a feather, but even the strongest person can't hold me for more than a few minutes. What am I?
Last Week's Answer:
Breath.
Meld Financial, Inc. is a registered investment advisor.
The information contained herein should not be construed as legal advice or a legal opinion on any factual situation. Its contents are intended for general information purposes only. Always consult with a competent professional service provider for advice on tax, accounting, and other financial matters specific to your situation.
Investing involves risks, and investment decisions should be based on your own goals, time horizon, and tolerance for risk. The return and principal value of investments will fluctuate as market conditions change. When sold, investments may be worth more or less than their original cost.
The forecasts or forward-looking statements are based on assumptions, may not materialize, and are subject to revision without notice.
The market indexes discussed are unmanaged, and generally, considered representative of their respective markets. Index performance is not indicative of the past performance of a particular investment. Indexes do not incur management fees, costs, and expenses. Individuals cannot directly invest in unmanaged indexes. Past performance does not guarantee future results.
Riddles used in this publication may originate from the books: Lateral Thinking Puzzles by Paul Sloane; or from Workspace Solutions, LLC.
The Dow Jones Industrial Average is an unmanaged index that is generally considered representative of large-capitalization companies on the U.S. stock market. Nasdaq Composite is an index of the common stocks and similar securities listed on the Nasdaq stock market and is considered a broad indicator of the performance of technology and growth companies. The MSCI EAFE Index was created by Morgan Stanley Capital International (MSCI) and serves as a benchmark of the performance of major international equity markets, as represented by 21 major MSCI indexes from Europe, Australia, and Southeast Asia. The S&P 500 Composite Index is an unmanaged group of securities that are considered to be representative of the stock market in general.
U.S. Treasury Notes are guaranteed by the federal government as to the timely payment of principal and interest. However, if you sell a Treasury Note prior to maturity, it may be worth more or less than the original price paid. Fixed income investments are subject to various risks including changes in interest rates, credit quality, inflation risk, market valuations, prepayments, corporate events, tax ramifications and other factors.
International investments carry additional risks, which include differences in financial reporting standards, currency exchange rates, political risks unique to a specific country, foreign taxes and regulations, and the potential for illiquid markets. These factors may result in greater share price volatility.
Please consult your financial professional for additional information.
This content is developed from sources believed to be providing accurate information. The information in this material is not intended as tax or legal advice. Please consult legal or tax professionals for specific information regarding your individual situation. The opinions expressed and material provided are for general information, and they should not be considered a solicitation for the purchase or sale of any security.