
Weekly Economic Update
Last Week and the Economy
- U.S. gas prices hit $4 per gallon amid the Iran conflict.
- The U.S. added jobs, and the unemployment rate declined marginally.
- Average wages rose, and hours declined.
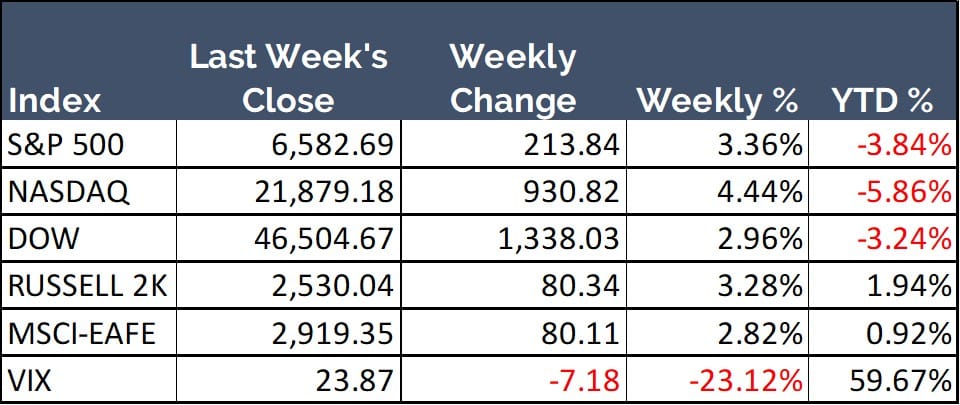
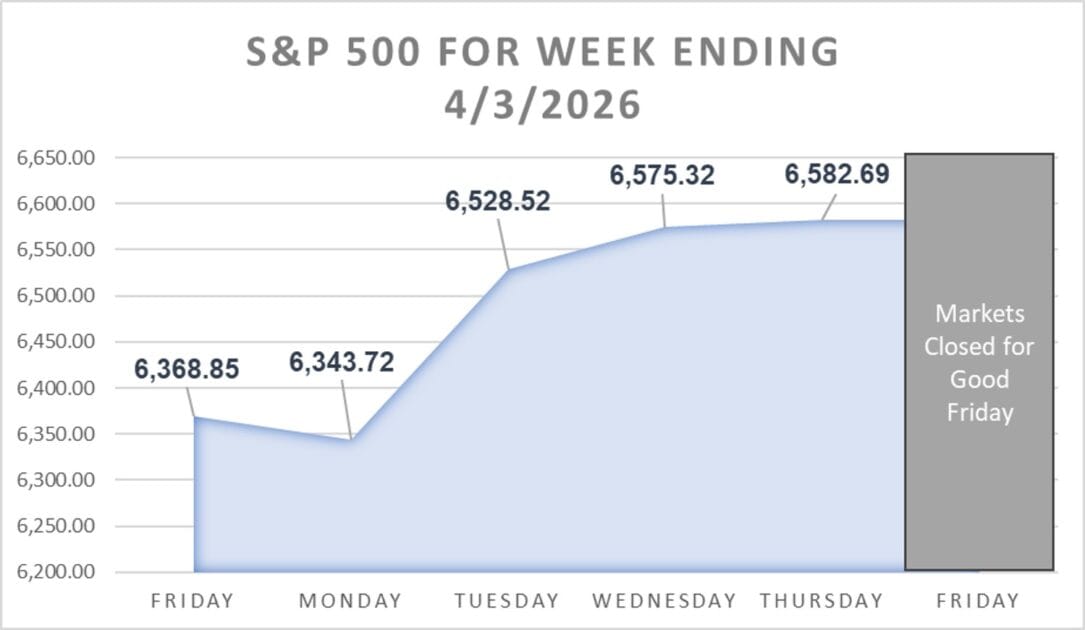
The major stock indices reversed course and rose last week. The Nasdaq Composite posted the largest weekly gain at 4.44% and the S&P 500 was not far behind with a gain of 3.36%. The Russell 2k Small Cap Index and Dow Jones Industrial Average also improved by 3.28% and 2.96%, respectively. The upward trend continued in international markets where the MSCI-EAFE Index rose by 2.82%.
U.S. Gas Prices Hit $4 Per Gallon Amid Iran Conflict
The nationwide average cost of a gallon of gasoline rose to $4.018, the highest cost since 2022. The surge above $4 per gallon marks a psychological milestone and brings the increase since the conflict in Iran began to more than 30%.
Amid rapidly rising gas prices, the Environmental Protection Agency [EPA] has lifted restrictions preventing the sale of E15 gas. This type of fuel has 15% ethanol, and it is typically prohibited in about half the U.S. during the summer months to reduce air pollution.
Additionally, the EPA issued a waiver to remove federal restrictions on E10 gas – which contains 10% ethanol. The agency is also lifting federal enforcement of some state-level fuel requirements in an effort to combat rising gas prices.
The Unemployment Rate Declined Marginally
The Bureau of Labor Statistics [BLS] released the Employment Situation Report for March, and it showed that the U.S. added 178,000 jobs. The monthly increase brought the unemployment rate from 4.4% in February to 4.3% in March.
The Health Care industry added the most jobs at 76,000, which included 35,000 jobs in physicians’ offices as workers returned from a strike. The Construction, Transportation & Warehousing, and Social Assistance sectors also added jobs for the month.
On the other hand, employment continued to decline in the Government sector. Employment in this industry is down by 355,000, or 11.8%, since it reached a peak in October 2024. Financial Activities also lost jobs last month, and the sector is down 77,000 jobs since a peak in May 2025.
Wages Rose While Hours Declined
The BLS also reported that average hourly earnings for private sector employees rose by $0.09, or 0.2%, to $37.38 in March. The latest increase brought the year-over-year rise in wages to 3.5%.
While wages rose, the average workweek declined by 0.1 hour to 34.2 hours. In the manufacturing sector, the average workweek was unchanged at 40.2 hours, and overtime remained at 3.0 hours per week.
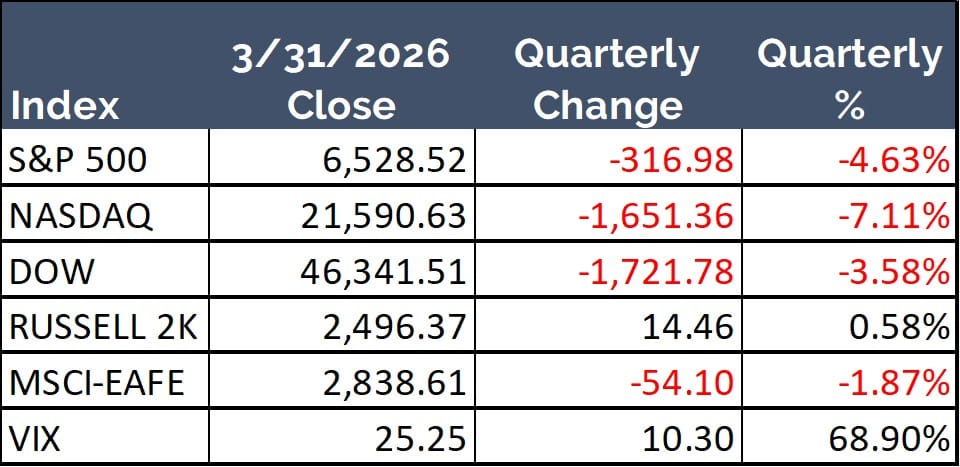
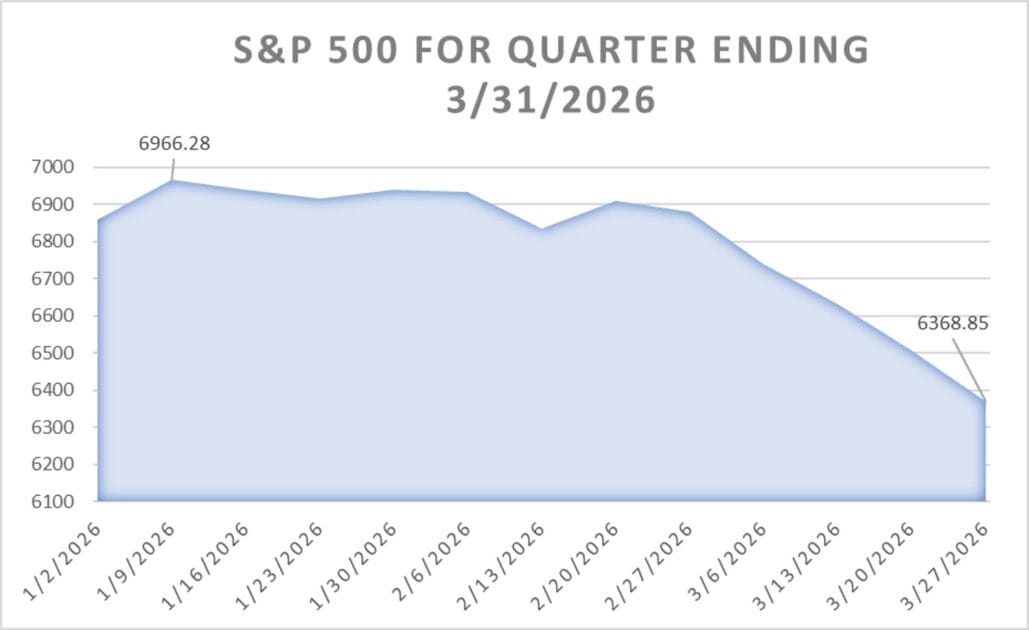
Q1 Equities Review
The major news stories of the first quarter began when the U.S. and Israel launched an attack on Iran. Gas prices rose substantially as the Strait of Hormuz was closed during the conflict, and stocks fell. The Russell 2k Small Cap Index entered a correction on March 20th, and the Dow Jones Industrial Average and Nasdaq Composite entered corrections the following week. Thus far, the S&P 500 has narrowly avoided the -10% threshold that would signify a correction.
Stocks rose in the first half of the quarter, then erased most of those gains following the onset of the Iran conflict. The Russell 2k Small Cap Index was the sole major index to post a quarterly gain, and it improved by 0.58%. The S&P 500 and Dow Jones Industrial Average fell by 4.63% and 3.58%, respectively. The Nasdaq Composite fared even worse and dropped by 7.11%. In international markets, the MSCI-EAFE Index also lost 1.87% for the quarter.
Data Sources for stock and index quotes: Yahoo Finance, WSJ
Trending Articles

How to Calculate Provisional Income (a.k.a. Combined Income)
August 14, 2025School of Social Security & Medicare
Your provisional income determines if Social Security benefits are taxable, so it is important to know how to calculate this figure.

5 Characteristics of a Quality Wealth Manager
June 15, 2023School of Financial Wellness
Looking for a quality wealth manager? We pulled together our list of the 5 most important qualities to consider during your search.

What are Required Minimum Distributions (RMD’s)?
July 21, 2023School of Saving and Investing
Required Minimum Distributions are minimum withdrawals that must be taken from retirement accounts once you reach a certain age.
Key Economic Data Points
| Data Point | Date | Current | Change from Prior Period | Next Report |
| Unemployment Rate | 03-2026 | 4.3% | -0.1 | May 8th |
| FOMC Target Rate | 3-2026 | 3.50% – 3.75% | 0 | April 29th |
| GDP | Q4 2025 | 0.7% | -3.7 | April 9th |
| PCE Inflation | 1-2026 | 2.8% | -0.1 | April 9th |
Data Sources: U.S. Bureau of Labor Statistics, FRED – St. Louis Fed, U.S. Bureau of Economic Analysis
Weekly Quote:
There is nothing noble in being superior to your fellow man; true nobility is being superior to your former self.
-Ernest Hemingway, Author
The Week Ahead – Economic Data & Events
Monday: Global Supply Chain Pressure Index (GSCPI)
Tuesday: Survey of Consumer Expectations
Thursday: Gross Domestic Product, Personal Income and the PCE Deflator, Wholesale Trade
Friday: Consumer Price Index, Michigan Consumer Survey (Preliminary), Multivariate Core Trend Inflation
Weekly Reports: Mortgage Applications (Wednesday), EIA Petroleum Status Report (Wednesday), Jobless Claims (Thursday), EIA Natural Gas (Thursday), Fed Balance Sheet (Thursday), Baker Hughes Rig Count (Friday)
Source: New York Fed
The Week Ahead – S&P 500 Companies Reporting Earnings
Tuesday: Lamb Weston Holdings (LW)
Wednesday: Delta Air Lines (DAL), RPM International (RPM)
Thursday: Constellation Brands (STZ), Conagra Brands (CAG)
Friday: BlackRock (BLK), JPMorgan Chase (JPM), Wells Fargo (WFC), Citigroup (C)
Source: Select Sector SPDRs Earnings Calendar
Weekly Tip:
Get your company match. If your employer offers 401(k) matching, contribute enough to take advantage of this “free” money.
Data Sources for stock and index quotes: Yahoo Finance, WSJ
Join Us for Our Next Meld University Events:
Last Week's Riddle and Answer
Last Week's Riddle:
What 5-letter word typed in all capital letters can be read the same upside down?
Last Week's Answer:
SWIMS can be read upside down and right side up.
Meld Financial, Inc. is a registered investment advisor.
The information contained herein should not be construed as legal advice or a legal opinion on any factual situation. Its contents are intended for general information purposes only. Always consult with a competent professional service provider for advice on tax, accounting, and other financial matters specific to your situation.
Investing involves risks, and investment decisions should be based on your own goals, time horizon, and tolerance for risk. The return and principal value of investments will fluctuate as market conditions change. When sold, investments may be worth more or less than their original cost.
The forecasts or forward-looking statements are based on assumptions, may not materialize, and are subject to revision without notice.
The market indexes discussed are unmanaged, and generally, considered representative of their respective markets. Index performance is not indicative of the past performance of a particular investment. Indexes do not incur management fees, costs, and expenses. Individuals cannot directly invest in unmanaged indexes. Past performance does not guarantee future results.
Riddles used in this publication may originate from the books: Lateral Thinking Puzzles by Paul Sloane; or from Workspace Solutions, LLC.
The Dow Jones Industrial Average is an unmanaged index that is generally considered representative of large-capitalization companies on the U.S. stock market. Nasdaq Composite is an index of the common stocks and similar securities listed on the Nasdaq stock market and is considered a broad indicator of the performance of technology and growth companies. The MSCI EAFE Index was created by Morgan Stanley Capital International (MSCI) and serves as a benchmark of the performance of major international equity markets, as represented by 21 major MSCI indexes from Europe, Australia, and Southeast Asia. The S&P 500 Composite Index is an unmanaged group of securities that are considered to be representative of the stock market in general.
U.S. Treasury Notes are guaranteed by the federal government as to the timely payment of principal and interest. However, if you sell a Treasury Note prior to maturity, it may be worth more or less than the original price paid. Fixed income investments are subject to various risks including changes in interest rates, credit quality, inflation risk, market valuations, prepayments, corporate events, tax ramifications and other factors.
International investments carry additional risks, which include differences in financial reporting standards, currency exchange rates, political risks unique to a specific country, foreign taxes and regulations, and the potential for illiquid markets. These factors may result in greater share price volatility.
Please consult your financial professional for additional information.
This content is developed from sources believed to be providing accurate information. The information in this material is not intended as tax or legal advice. Please consult legal or tax professionals for specific information regarding your individual situation. The opinions expressed and material provided are for general information, and they should not be considered a solicitation for the purchase or sale of any security.